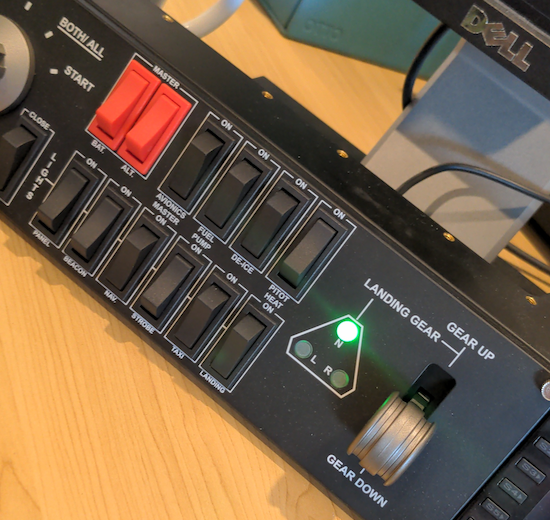
About a month ago I got my switch panel controlling my PC. In short, I use a Logitech/Saitek PZ55 Flight Switch Panel connected to a Raspberry Pi that reads USB HID input from the panel and sends PSExec commands to my gaming PC.
It’s honestly been a lot of fun to use over the past month and it was so weird going back to the office and using a computer that didn’t have a bunch of physical switches you could toggle to control. It really makes the experience of using a computer a lot more fun and personal.
Just after New Years I realised that the panel has a couple of lights on the front labelled “Landing Gear”. I suppose in a flight simulator they’re designed to show you the status of your aircraft landing gear; up, down, or faulty.
But why can’t I use them for my own purposes?
So after a bunch of fucking around I’ve added a new feature to my panel: the lights can show heavy activity on my computer.
The project consists of the following:
- InfluxDB as a time series database collecting metrics.
- Telegraf running on my Windows machine to send metrics to InfluxDB.
- A Python script running every minute on the RaspberryPi to pull updates and update the switch panel.
I probably didn’t need an entire time series database for this project, but I’ve got a few other projects in the pipeline that will be using one so this was a good excuse to test one out and learn the ropes.
InfluxDB
This was pretty simple to set up, as a first prototype it really is just default settings running on a VM but as I do more work with it I’ll work on security and authentication.
Just follow the pretty decent install docs and you should be set up.
Telegraf
This one took a bit more messing around, because Window support is definitely a second class citizen here and the docs keep referencing older verisons of InfluxDB so you’ll have to go between the Telegraf docs and the InfluxDB ones to realise what needs to be changed, especially around token authentication.
Make sure when you install the Telegraf service, you specify the config file it needs to point at otherwise it’ll load a blank default config and you’ll spend ages wondering why no metrics are being sent.
In terms of plugins for Telegraf, I used two of the built-in ones:
- Nvidia SMI to track my GPU.
- Windows Performance Counters to track other generic hardware stats on my computer.
Copying and pasting from the docs is probably recommended if you’re just getting started and want to make sure it works, it saved my bacon.
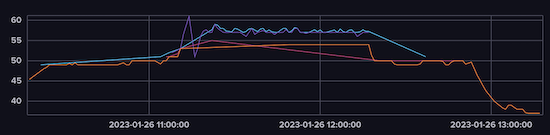
At this point, you should be able ot generate some pretty graphs from the InfluxDB dashboard. Here’s a basic one tracking all temperature_gpu fields from the nvidia_smi measurement in my InfluxDB instance:
Querying
InfluxDB has it’s own query language called Flux and there’s a wealth of StackOverflow answers to help if you have any issues. The graph we’ve got already gets us part of the way there, but there’s two problems we need to solve.
Firstly, we don’t need a graph, we only need the latest value. Thankfully Flux has a simple function for that: last(). Piping your data through that will return only the most recent result.
The other problem is that our GPU has multiple power states that are activated under different loads, with each one presenting a temperature value. This is why we have multiple lines in our graph. But we can simply this with a group() statement in Flux to gather them all and then use that last() function to only return the most recent value regardless of power state.
Roughly you’ll end up with a query like the following
from(bucket: "home")
  |> range(start: -5m)
  |> filter(fn: (r) => r["_measurement"] == "nvidia_smi" and r["_field"] == "temperature_gpu")
  |> group(columns: ["field"], mode: "by")
  |> last()
  |> yield(name: "temp")
Python
For the Python script, you can once again use the great InfluxDB docs and their Python API. You’ll want to do a simple read operation, but don’t forget your org/bucket/token.
Once I’ve setup the client, I just do the following:
query_api = client.query_api()
query = 'from(bucket: "home")\
  |> range(start: -5m)\
  |> filter(fn: (r) => r["_measurement"] == "nvidia_smi" and r["_field"] == "temperature_gpu")\
  |> group(columns: ["field"], mode: "by")\
  |> last()\
  |> yield(name: "temp")'
result = query_api.query(org=org, query=query)
for table in result:
    for record in table.records:
        temp = record.get_value()
        print(temp)
        with hid.Device(0x06a3, 0x0d67) as h:
            if temp > 52.0:
                h.send_feature_report(bytes([0x0, 0x1]))
            else:
                h.send_feature_report(bytes([0x0, 0x0]))
I use cron to run this script every minute and update the light. This will turn it green if we’re running over 52.0˚C and turn it off otherwise.
It’s left as an exercise to you to start implementing other cool functions with this. You could switch the light red if it was running too hot, use other lights for CPU or network bandwidth, or whatever else tickles your fancy.